Usage statistics in W3 Total Cache Pro is a powerful tool for fine-tuning your caching performance and improving page load times in WordPress. By tracking detailed metrics related to caching and content delivery, you can gain valuable insights into your site’s performance and uncover opportunities for optimization. Whether you’re monitoring cache hit rates, analyzing CDN effectiveness, or reviewing purge logs, W3 Total Cache’s statistics provide the information you need to make data-driven adjustments that enhance your website’s speed and efficiency. This guide explores the key statistics features in W3 Total Cache and how to leverage them to optimize your site.
Speed Up Your WordPress Website.
A Difference of Just 100ms in Page Load Speeds Can Cause a Visitor to Prefer Your Competitor’s Website.
Enabling and Configuring W3 Total Cache Statistics
To start using the statistics feature in W3 Total Cache, follow these steps:
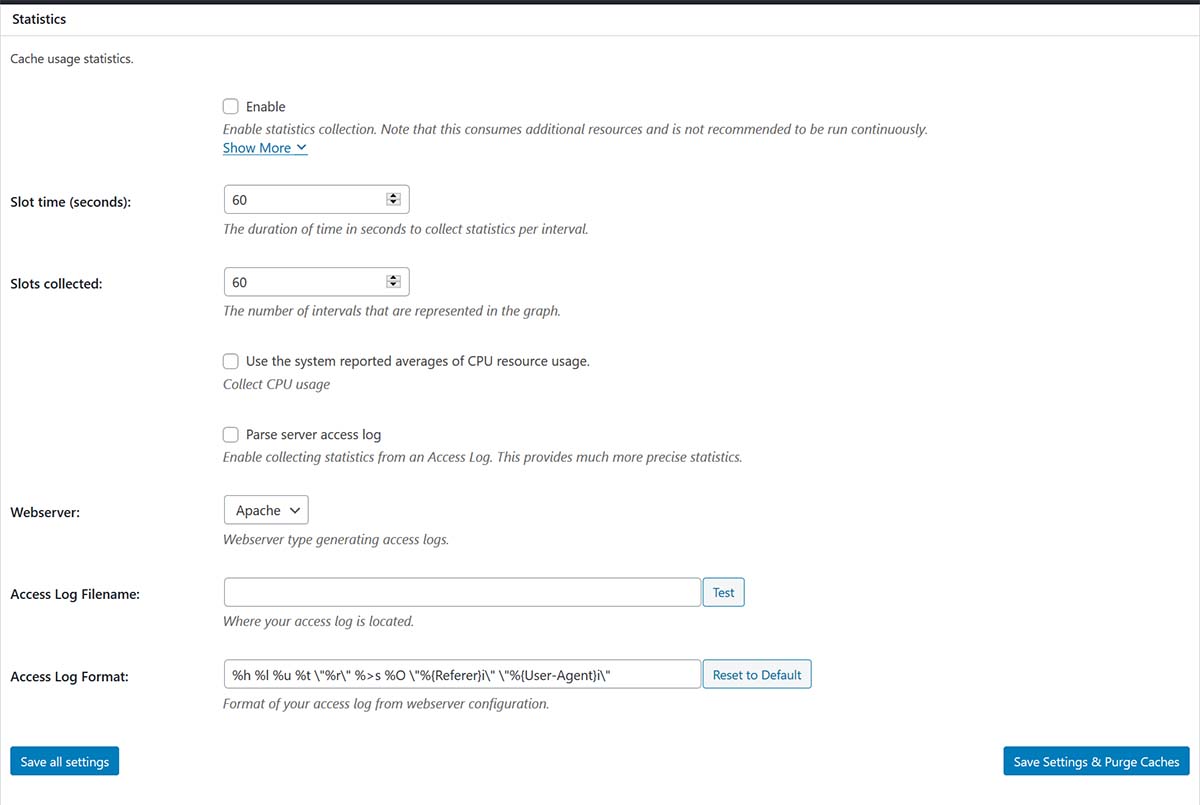
- Navigate to Performance → Statistics in your WordPress Dashboard.
- Select Enable to activate statistics tracking.
- Click Save All Settings to save your changes.
Once enabled, W3 Total Cache statistics provide detailed insights into how your backend is performing, allowing you to optimize your WordPress site and server resources for the best possible performance. It’s important to note that using statistics can cause performance degradation, so it’s recommended to use this feature sparingly and only when needed.
Understanding W3 Total Cache Statistics Features
Statistics can be enabled with minimal configuration, but you also have the options to adjust the interval of which stats are captured and provide the path to the webserver access logs and format, allowing you to quickly compare them against your WordPress caching statistics.
Caching Statistics
- Overview: Caching statistics provide a summary of how your caching mechanisms are performing. This includes data on the different types of caches enabled, such as page cache, database cache, object cache, and browser cache.
- Details Tracked: This statistic tracks the number of cache hits (when cached content is served) and cache misses (when uncached content is served). Understanding these numbers helps you determine how effectively your caching setup is working and identify areas where caching may not be utilized properly.
Cache Hit/Miss Rate:
- Overview: The Cache Hit/Miss Rate statistic measures the effectiveness of your caching strategies by calculating the ratio of cache hits to cache misses. A higher hit rate indicates that more requests are being served from the cache, which reduces server load and improves page load times.
- How It Works: W3 Total Cache tracks every request to determine whether it was served from the cache (hit) or required server processing (miss). This data is then used to calculate the hit rate percentage, providing a clear indicator of your cache performance. Ideally, you want this percentage to be as high as possible, indicating efficient caching.
- Improving Cache Hit Rate: To improve your cache hit rate, ensure that all cache types relevant to your site are enabled and configured correctly in the General Settings. Additionally, review the Cache-Control headers to ensure they are set appropriately for your content types.
CDN Stats:
- Overview: CDN (Content Delivery Network) statistics track how well your integrated CDN is performing in conjunction with W3 Total Cache. This includes metrics on bandwidth usage, the number of requests served by the CDN, and the cache hit/miss rate at the CDN level.
- Why It’s Important: Monitoring CDN stats is crucial for understanding how effectively your CDN is reducing server load and improving content delivery speed. By analyzing this data, you can optimize your CDN settings to better serve your global audience.
- Optimization Tips: Regularly review your CDN stats to identify patterns or issues, such as regions with lower performance or higher miss rates. Adjusting your CDN configuration or optimizing your content delivery settings can address these issues and enhance overall site performance.
Purge Log:
- Overview: The Purge Log tracks instances where cached content is purged or invalidated. This could be due to changes in content, cache expiry rules, or manual purging actions taken through the W3 Total Cache interface.
- How It Helps: Monitoring the Purge Log helps you understand how frequently and why cached content is being invalidated. This information is valuable for troubleshooting caching issues, such as unexpected purges that may affect performance.
- Managing Purge Frequency: Excessive purging can lead to higher cache miss rates and increased server load. To minimize unnecessary purges, carefully configure your cache expiration settings and only purge cache when necessary.
Best Practices for Using W3 Total Cache Statistics
- Use Statistics for Short Periods: Since enabling statistics can impact performance, it’s best to use this feature for limited timeframes, such as during performance audits or when troubleshooting specific issues.
- Combine with Debug Tools: Pair the insights from W3 Total Cache statistics with other debugging tools and server access logs for a comprehensive view of your site’s performance. This combined approach can help identify the root causes of performance bottlenecks.
- Adjust Capture Intervals: Configure the interval at which statistics are captured to balance the need for data with the impact on performance. Shorter intervals provide more granular data but can increase server load.
- Ensure Correct Cache Settings: Make sure the caches you want to monitor are enabled in the General Settings of W3 Total Cache. For accurate statistics, also ensure that you’re not logged in while testing, as logged-in users are typically not served cached content.
By leveraging the statistics feature in W3 Total Cache, you can gain valuable insights into your caching performance and identify opportunities for optimization. Whether you’re fine-tuning cache settings or adjusting CDN configurations, these statistics provide the data needed to make informed decisions that enhance your site’s speed and user experience.
W3 Total Cache
You haven't seen fast until you've tried PRO
Full Site CDN + Additional Caching Options
Advanced Caching Statistics, Purge Logs and More
Everything you need to scale your WordPress Website and improve your PageSpeed.