When using WordPress and W3 Total Cache it can sometimes be a mystery to solve performance issues. Enabling debugging tools will provide HTML comments about your caching configuration, and whether it was a hit or miss to help you track down those issues that can otherwise be overlooked.
Warning: Debugging can have an adverse impact on your site performance. Use it sparingly, and disable it when not using to ensure you have the fastest WordPress site.
Troubleshoot performance problems and speed up your WordPress website with W3 Total Cache Pro.
Configure W3 Total Cache Debug in WordPress
- In your WordPress Dashboard, navigate to Performance → General Settings
- Scroll down to the Debug section.
- Select any cache to see information about it in your sites source code
- Click Save all settings
Viewing your sites source code
To see the information appended to your site by W3 Total Cache’s debugging tool, you would check your sites source code. In most cases, this is done by right clicking on the website, and selecting View Source.

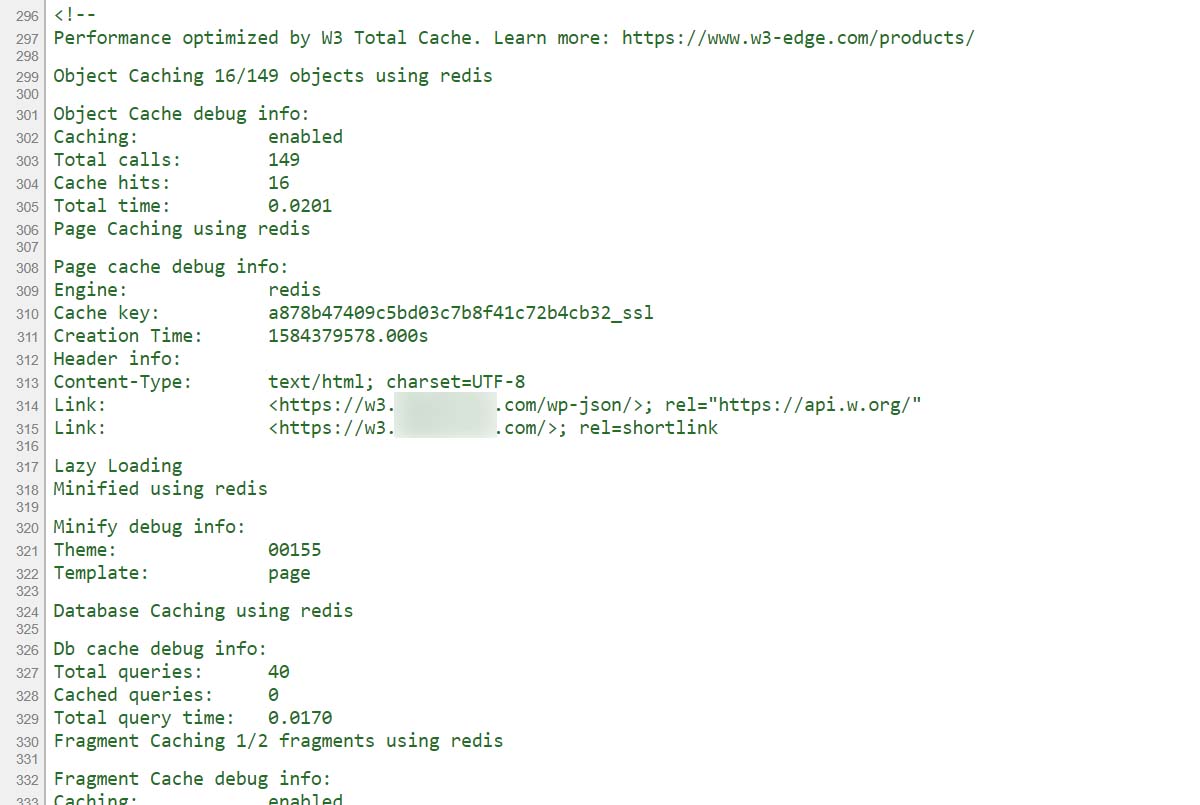
Once there, scroll all the way down and you will see output similar to the following image:
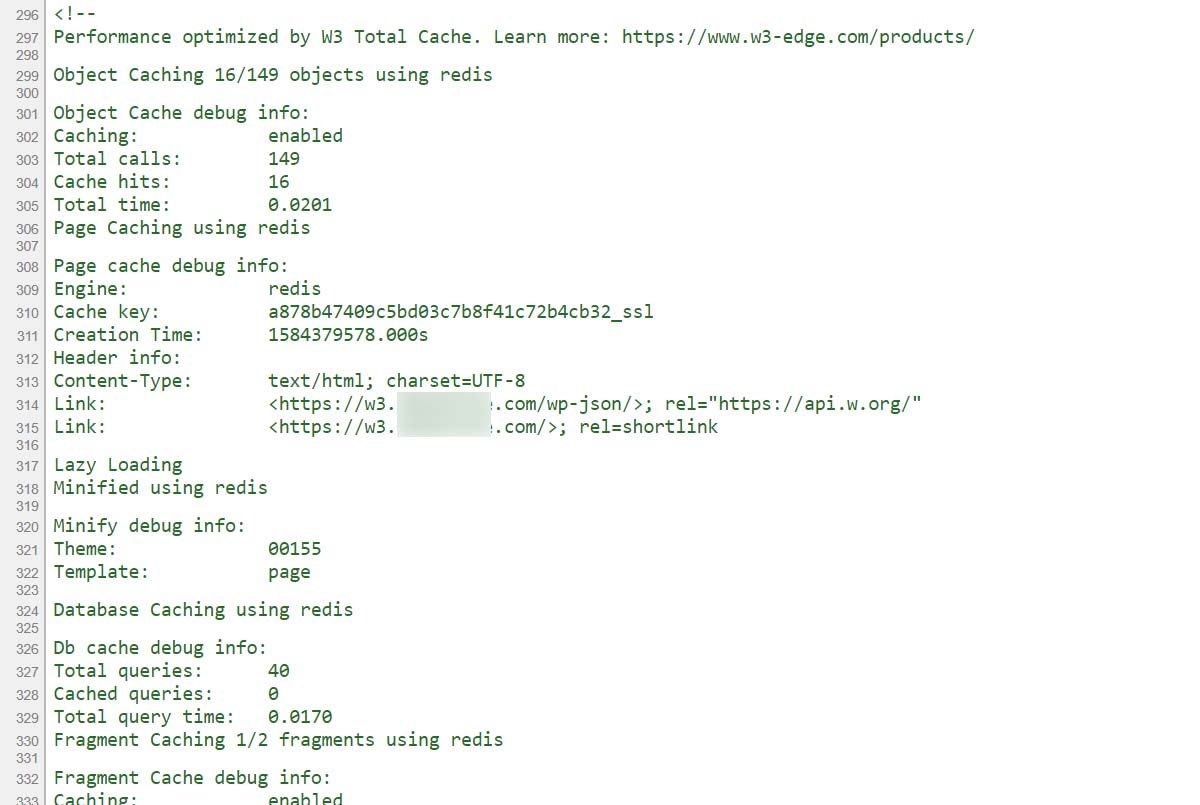
That is it! Note that it is showing nothing was cached, because I was logged in at the time of viewing it.
You now know how to use W3 Total Cache Debugging tools to monitor the status of your various caches. Next, you may want to enable the Statistics Pro Feature for a more granular look at your caching methods and hit rates.
W3 Total Cache
You haven't seen fast until you've tried PRO
Full Site CDN + Additional Caching Options
Advanced Caching Statistics, Purge Logs and More
Everything you need to scale your WordPress Website and improve your PageSpeed.
Kassim says:
I have version 2.6.0 installed and I’m reminded that I should update it to 2.6.1, but when I try to do that it says it can delete the old php file and fails. If I try to delete 2.6.0 it won’t do that either and fails due to some file permission problem. I’ve posted two requests on the forum and had no response. I may just move to WP Rocket instead. Please advise.
Marko says:
Hello,
I have replied to your forum topic.
This is not specifically related to the W3 Total Cache but to your server permissions.
Please check the forum post