In our recent Google PageSpeed Experiments we have been testing the various features and benefits of W3 Total Cache. In this experiment we are testing the REST API caching features. However, Google PageSpeed is a tool meant to test pages and websites. Since we are working with the WordPress REST API in this experiment, we don’t have a page we can test with Google PageSpeed. In this experiment we used tools such as loader.io to demonstrate and understand the impact of REST API caching on website performance.
In this test, using REST API caching reduced our Average Server Load by 40%! Check out the documentation to see how to take advantage of this feature on your site!
Upgrade to W3 Total Cache Pro and improve your PageSpeed Scores today!
Control Website
On our control website we installed WordPress and used the FakerPress plugin to generate some generic posts to use for our WP REST API requests. For our test we used the REST API to pull a single post from the site.
Request from control website: https://wordpress-speed-test.com/043024_site1/wp-json/wp/v2/posts?per_page=1&_fields=id,title,excerpt&page=1
Experimental Website
With our experimental website, we made a clone of our control website to include the same plugins and posts from our Control site.
We also installed W3 Total Cache Pro and turned on REST API Caching.
Request from experimental website: https://wordpress-speed-test.com/043024_site2/wp-json/wp/v2/posts?per_page=1&_fields=id,title,excerpt&page=1
Experimental Website Changes
We used the requests listed above to ensure that the same amount of data is pulled from both sites and narrowed it down to a single post so that it is easy to compare and see that the same data is being returned.
REST API requests in a vacuum are small and relatively quick, but often will be done repeatedly or in larger amounts. While a single request doesn’t have much impact, several requests can add up and be taxing on server resources.
On our experimental website we simply enabled the Cache option in the REST API section of the page cache settings as shown in the screenshot below:

In this test, using REST API caching sped up our API Responses by 84.5%! Read the documentation to learn how you can cache your API Requests.
Upgrade to W3 Total Cache Pro and improve your PageSpeed Scores today!
How the test was run
We conducted two separate tests on both sites using loader.io. We also tracked the load average on the server during each test to get a full picture of how the REST API requests perform with and without the caching feature enabled.
The first test
This test was to simulate typical medium levels of traffic. We wanted to see what happens when 250 clients make the same REST API request in a 60 second time span.
Control Site Results
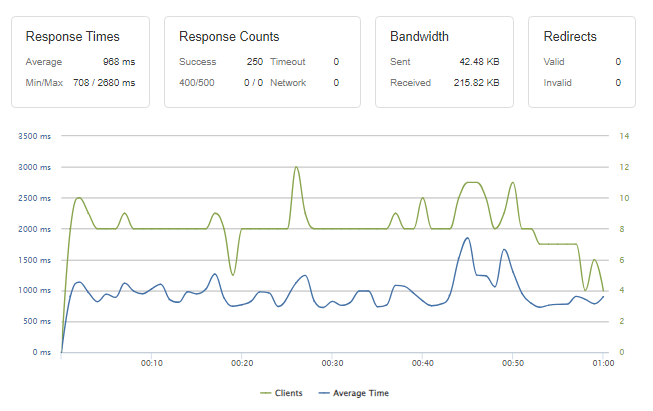
On our control site all of our visitors were able to make their request without any errors. It took just under a second on average for each client to receive a response from the API. We included a screenshot of the results below. One important thing to note is the fluctuation on the average time and the average time scale on the left.
Experimental Site Results
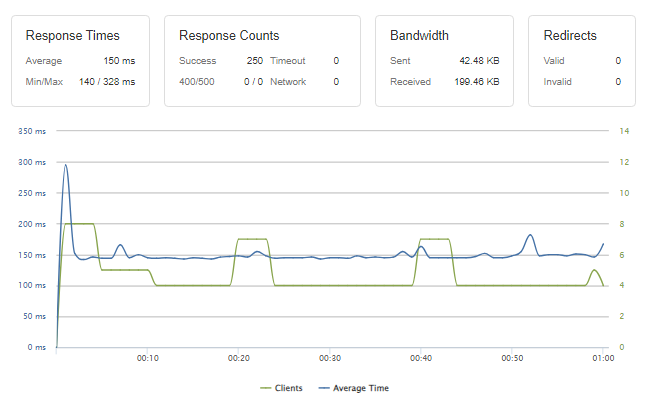
Just as on our control site, all of our visitors to the experimental site were able to make their requests successfully without any errors. The results show that the response time of each request was much more consistent and took 150ms to complete on average. We included a screenshot of the results, be sure to note the average time scale on the left.
Comparing Request Response Times
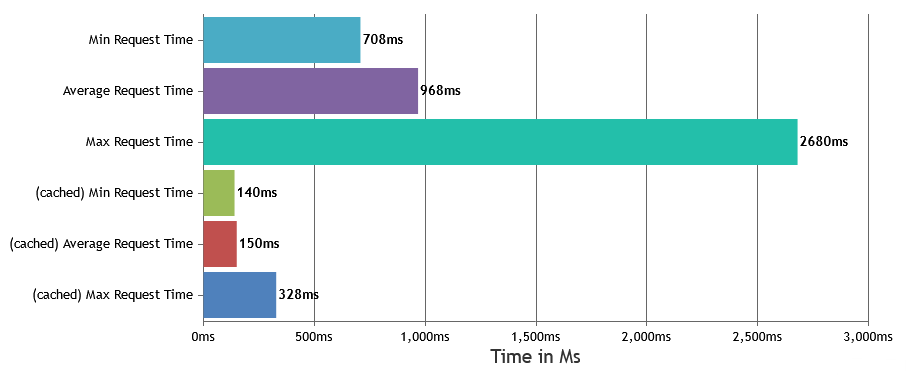 As we can see, the Responses were much faster on the cached site, this indicates that the requests to the REST API are completing more quickly and efficiently.
Load average
During the test we recorded the load average on the server and created a chart to illustrate the impact of the test on the server load:
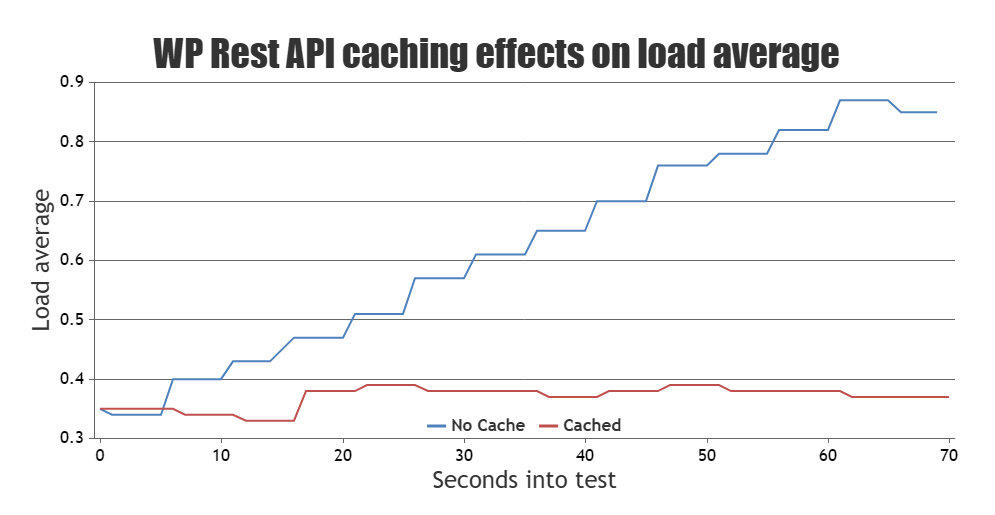
While both sites were able to complete all requests without any issues, the control site nearly topped out on resources, this could have led to errors or impacted the performance of any subsequent requests. Had the test been longer than 60 seconds we likely may have seen some errors in the loader.io results. In contrast, the cached site was able to handle the requests faster and without significantly increasing the server load.
Average Traffic Test
In this test, using REST API caching allowed us to serve 25 times the amount of API requests under high traffic using less server resources. Read the documentation to learn how you can cache your API Requests.
Upgrade to W3 Total Cache Pro and improve your PageSpeed Scores today!
The second test
For the second test, we simulated a burst of traffic. We wanted to see how well both sites performed when repeated requests are made by multiple clients over the course of one minute. Starting from 0 clients up to 250, each client would repeat the request after the previous request was completed.
Control Site Results
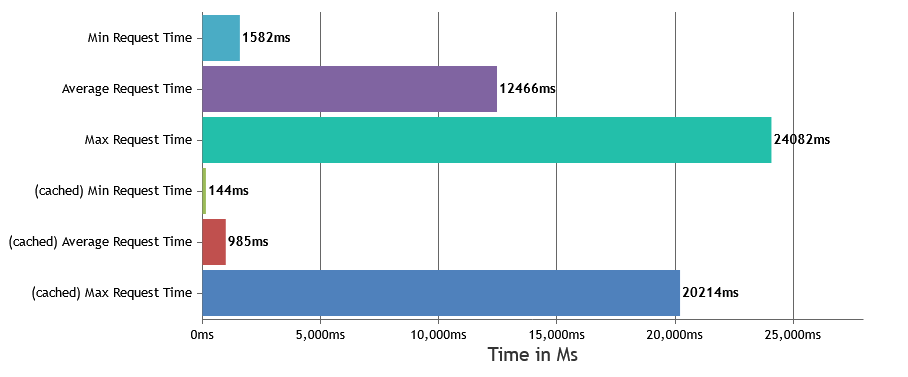
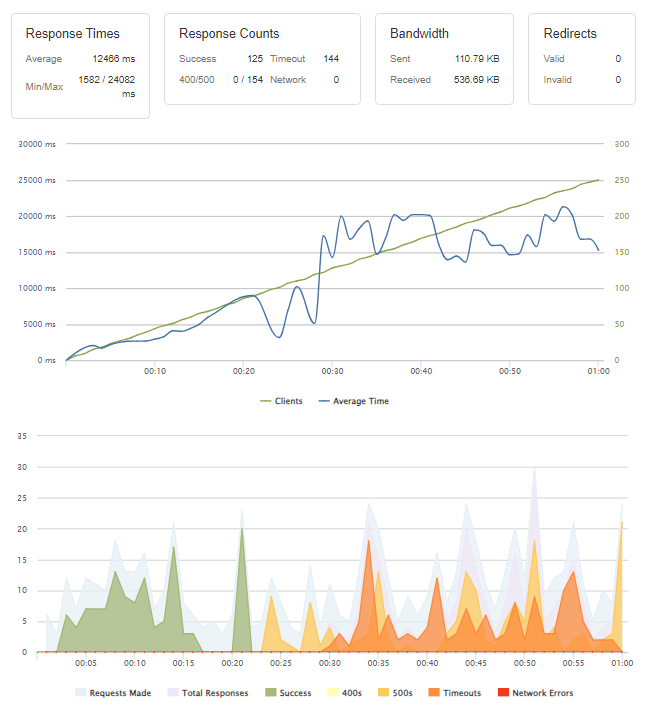
On our control site, a total of 269 request were made but only 125 were completed successfully. Real clients may have experienced errors or timeouts and the requests took significantly longer than they did on the first test at an average of 12 seconds. We included a screenshot of the test results below, be sure to note the time scale on the left goes up to 30 seconds.
Experimental site results
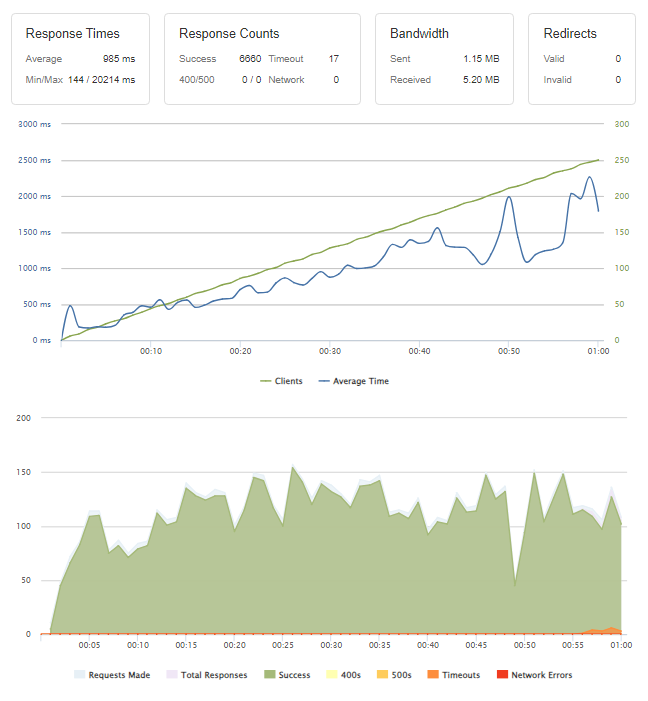
After letting the server recover from this test on the control site, we ran it again, this time on the cached site. We received significantly less errors and timeouts and the requests all completed in under a second on average. We included a screenshot of the results below, be sure to note that the time scale values on the left only goes up to 3 seconds on this one:
Comparing Request Response Times
On our cached site, we initially saw much quicker responses and our average was still under a second. If we look at the previous charts we can see that the un-cached site started encountering timeouts and slow responses less than halfway through which drove up our average and max response figures. Our cached site was able to make it 55 seconds in before running into similar issues. If we look at the server load statistics we can see what’s happening.
Load Average
Just as we did on our first test we also recorded the server load average for both sites:
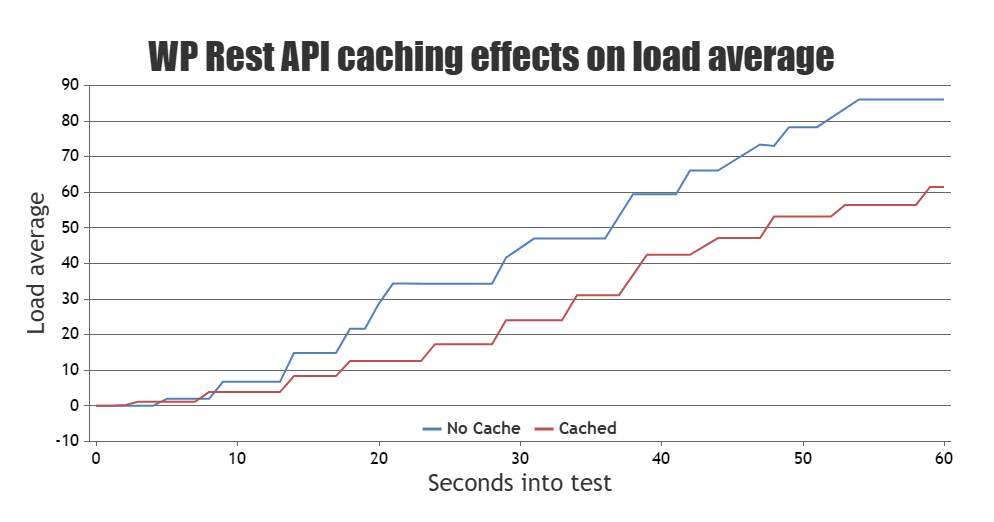
At first glance the cached site does appear to perform better but the graph still shows the server load increasing significantly on the cached site. To understand why, we took a look at the total number of requests from each test on both sites. The control site received a total of 269 requests while the cached one received a whopping total of 6677 requests. So while the chart shows similar changes in server load the cached site is still seeing less resources used in total for nearly 25 times the number of requests.
High Traffic Test
In this test, using REST API caching reduced our Average Server Load by 24% under during a major traffic spike! Check out the documentation to see how to take advantage of this feature on your site!
Upgrade to W3 Total Cache Pro and improve your PageSpeed Scores today!
Comparing The Results
Unlock exceptional performance improvements for your WordPress site with the W3 Total Cache plugin, as shown by our detailed performance analysis. When REST API caching is enabled, the results are simply transformative.
For standard operations, the average response time is dramatically reduced by 84.5%, decreasing from 968 ms to just 150 ms, and server load is lowered by 40%, ensuring smoother and more stable site operation. The plugin effectively manages bandwidth while maintaining a high rate of successful responses.
For more intensive scenarios involving higher traffic and data loads, the impact is even more pronounced: Average response times see a 92% improvement, from 12,466 ms to 985 ms. The plugin also significantly reduces the incidence of timed-out responses by 88% and supports a more than 5000% increase in successful responses. Server load experiences a noticeable reduction, enhancing site resilience under heavy demand.
Implementing W3 Total Cache not only elevates site performance during everyday usage but also ensures robustness and reliability under peak conditions, making it an indispensable solution for any WordPress site aiming to optimize efficiency and user experience.
W3 Total Cache
You haven't seen fast until you've tried PRO
Full Site CDN + Additional Caching Options
Advanced Caching Statistics, Purge Logs and More
Everything you need to scale your WordPress Website and improve your PageSpeed.
