Using the Purge Cache Log in W3 Total Cache
When you’re troubleshooting your website’s performance, you need to be sure that your cache is only being purged when necessary. In order to avoid using server resources to rebuild your cache, it will be useful to know exactly what caused a cache purge. As of W3 Total Cache release 0.13.0, a new pro feature— Cache Purge Logs— makes this easier than ever before.
Speed Up Your WordPress Website.
A Difference of Just 100ms in Page Load Speeds Can Cause a Visitor to Prefer Your Competitor’s Website.
Background
W3 Total Cache uses “triggers” in WordPress, known as hooks, to cause an automatic purge of your cache when certain events occur. For example, if an author publishes a new post, an action is triggered in WordPress called wp_insert_post. W3 hooks into this function and adds the post to your Page Cache each time it’s called.
In that example, the cache purge— sometimes known as a cache flush— is warranted, so that the new post can be added to the Page Cache. Likewise, there are many times when your cache needs to be rebuilt. However, you may find that a plugin, theme, or another aspect of your website is triggering an automatic cache purge when you don’t need it.
Frequently rebuilding your cache can cause performance issues on your web or database server, and might even impact your CDN usage by exceeding data transfer limits. This is when you need to be able to determine what’s causing cache purges.
Enabling Cache Purge Logs in W3 Total Cache
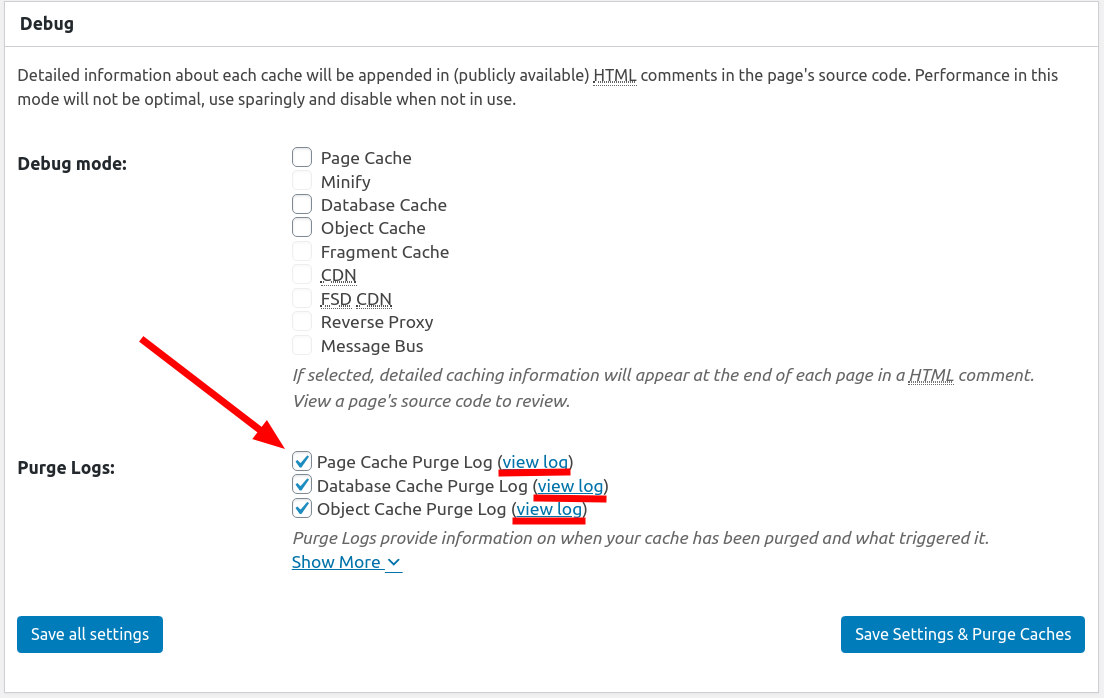
There are three cache purge logs available to pro users— the Page Cache, Database Cache, and Object Cache.
- Navigate to Performance -> General Settings -> Debug.
- Check the box(es) for your desired log(s) and click Save all settings.
- (Optional) If the checkbox is disabled, that cache type is not enabled in your settings. Visit the relevant section in General Settings and enable the cache type.
- Once an undesired cache purge event happens, click View log to examine the event.

Interpreting the Cache Purge Logs— Reading a WordPress Stack Trace
Now that logging is enabled, you’ll see that each purge event has a log including the timestamp of the event, the action that it performed, the user who triggered it, and the Stack Trace of the event.
Reading a Stack Trace can seem intimidating at first because of the amount of information it contains, but using this information you can see the entire sequence of events that causes your cache to update. Here’s an example of an administrator using the “Purge Page Cache” button from the WordPress Dashboard.
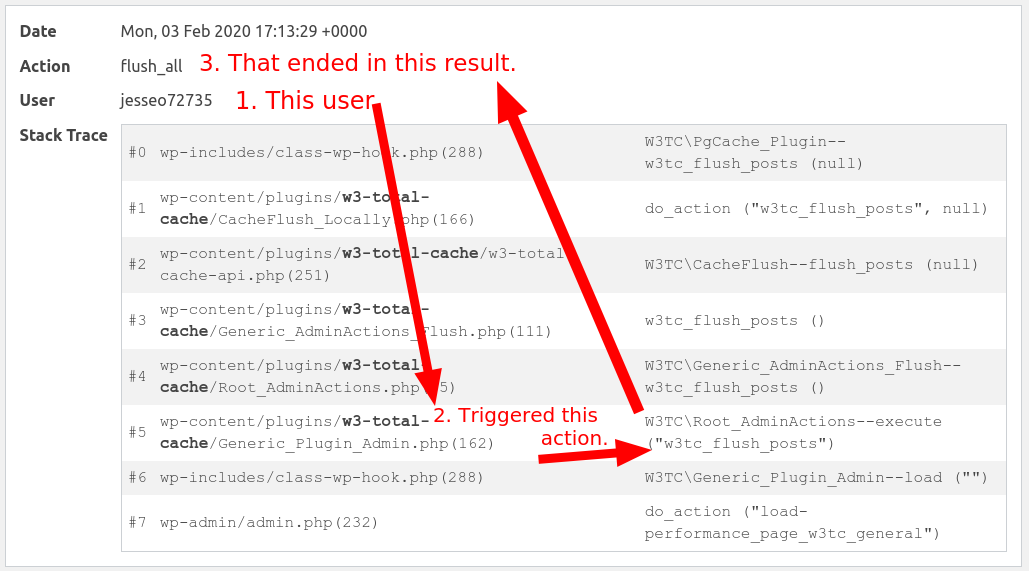
If you’re accustomed to reading system logs, one of the big differences between a log and a stack trace is that the last event is the first in the log, and the first event appears last in the log. So in this instance, we can walk through exactly what the user did.
- (#7 in the stack trace) The user was visiting the WordPress Dashboard— wp-admin/admin.php
- (#5 in the stack trace) The user interacted with a control defined in the w3-total-cache plugin’s “Generic_Plugin_Admin.php” file— specifically the “w3tc_flush_posts” control.
- (#1 in the stack trace) The plugin performed the action “w3tc_flush_posts.”
Each step in a stack trace tells you precisely which line of code caused the next action in the stack trace.
That’s a lot of information, how do I spot the important parts?
As you can see in the screenshot, the plugin or theme that caused the flush is highlighted in bold text. For most WordPress site administrators, this is the biggest piece of information you need to diagnose the cause of unwanted cache flushes.
Here’s another example of a plugin causing a flush event:
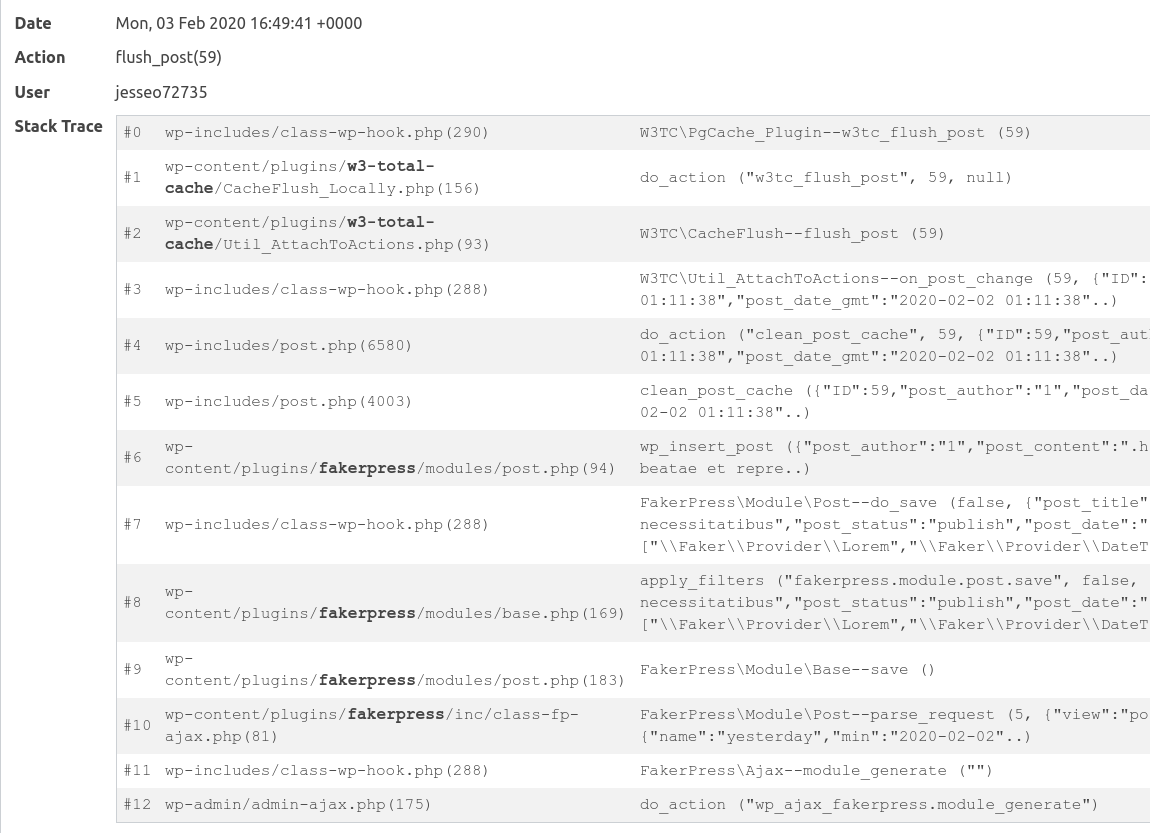
In this example, the user is interacting with a plugin called fakerpress, which created a post using the wp_insert_post action. The action it eventually called was to flush the cache for a single post, with the Post ID 59.
Resolving Cache Purge Issues
Once you’ve identified the User, Plugin, Theme, or event that’s causing your cache to be purged unnecessarily, you can take steps to resolve or mitigate the issue. This may be as simple as disabling a plugin you don’t need, or it might be as complicated as customizing your WordPress Cron schedule. If you need help resolving the issues you find in your Cache Purge Logs, let us do the work for you with premium support.
The Actual Purge Log Files
If you leave the purge logs running for an extended period of time, the log files themselves may grow quite large. When you’re viewing the pure logs, at the top of the page you’ll find both the full path to the log file and a button to clear the log file.
W3 Total Cache
You haven't seen fast until you've tried PRO
Full Site CDN + Additional Caching Options
Advanced Caching Statistics, Purge Logs and More
Everything you need to scale your WordPress Website and improve your PageSpeed.
Justin says:
It looks like these purge log files can get rather large if left on. Where are the log files saved, and, is there a way to clear them?
Jesse says:
Hi Justin-
In your Performance > General Settings > Debug section, you’ll see a link to view log next to each of the purge logs. Click on that, and you’ll find both the filepath of the log, and a button that lets you Clear log.