Introduction
W3 Total Cache’s purpose and goal is to improve website performance via a suite of powerful features and tools. Measuring the impact however was previously challenging without the use of 3rd party tools like Google PageSpeed Insights or GTMetrix, which both analyze a given URL and provide a detailed breakdown of performance metrics. These metrics are vital in determining if and where performance issues exist and can assist in identifying potential solutions. Due to the importance and impact such metrics can have, W3 Total Cache has integrated the Google PageSpeed Insights API and will now feature a homepage analyzer that will gather and display such metrics along with a brief description and our recommendations as to how to address each metric point in the event of poor performance ratings. For certain metrics our recommendation will include instructions on how to enable and configure specific features that will address the given problem. As an example, issues pertaining to unminified CSS and JavaScript as well as render blocking elements can be resolved by enabling and configuring our Minify feature.
Authorization
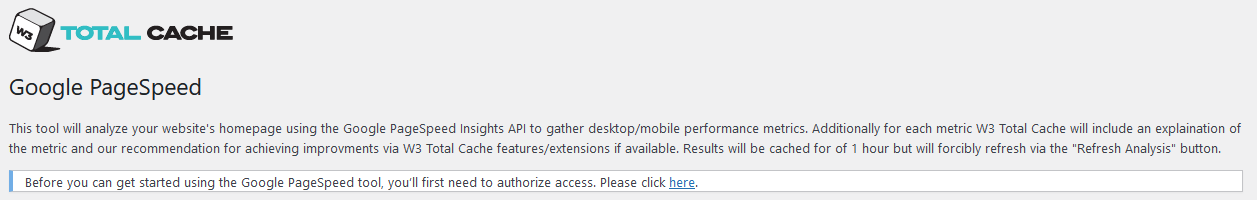
In order to utilize the new Google PageSpeed feature, you must first authorize a W3 Total Cache to perform analytics on your behalf. To accomplish this you must visit the General Settings page under Performance via the WordPress Admin Dashboard. Once there simply navigate to the Google PageSpeed section either manually or by clicking on the link at the top of the page. Once at the section you will se an “Authorize” button that will direct you to sign into a Google account. Doing so should authorize the request and return you to the General Settings page. That’s it! From there you can navigate to the Google PageSpeed analytics page via the menu link under the Performance menu
- Navigate to the General Settings admin page either via the WordPress admin sidebar or via the link provided on the Google PageSpeed analytics page.


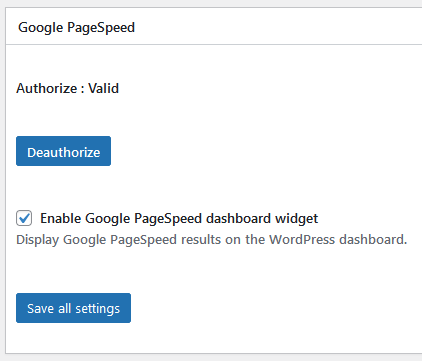
- Locate the Google Pagespeed section and click the Authorize button.

- Confirm that the authorization was successful. If so then navigate to the Google PageSpeed analytics page either via the admin sidebar or W3TC Settings page topmenu.


Analytics Page
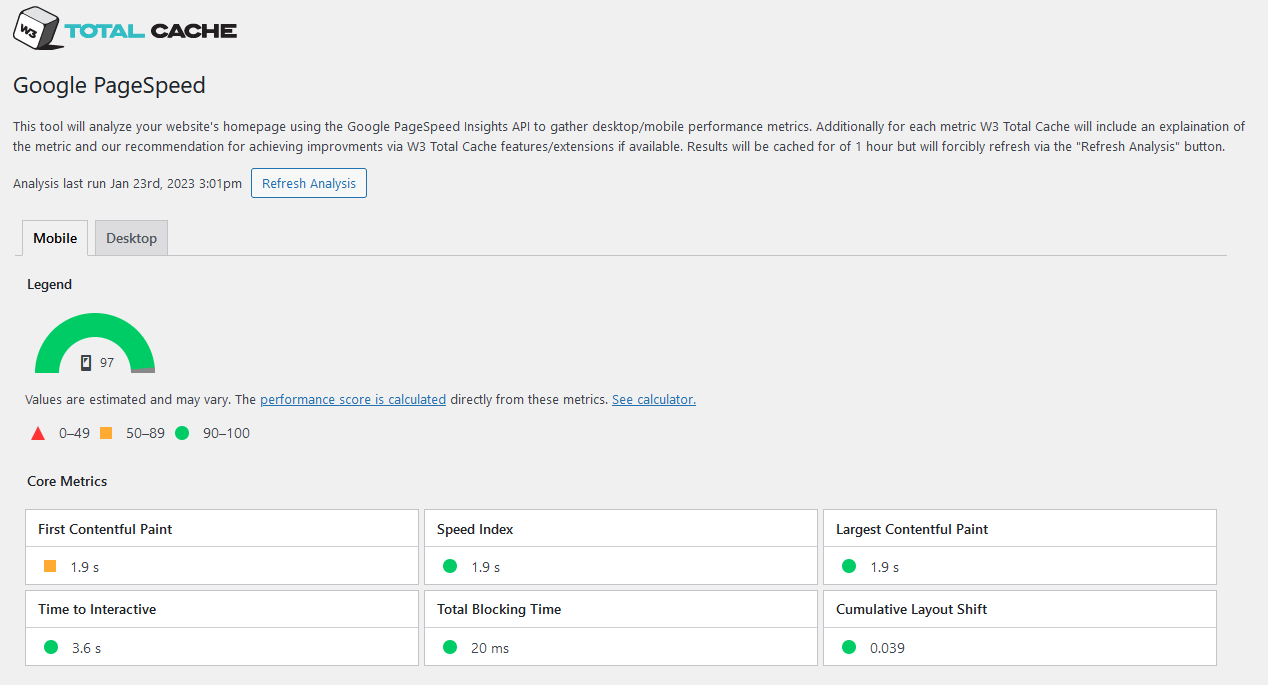
- Once authorized you can re-visit the analytics page. If no metrics have been gathered previously it should perform an analysis that can take up to 2 minutes to complete. The results are cached for up to an hour but can be manually refreshed via the “Refresh Analysis” button.
- The analysis collects metrics for both the mobile view and desktop view of the website. These are then displayed separately via tabs labeled accordingly. On each of these tabs, the data is displayed in sections
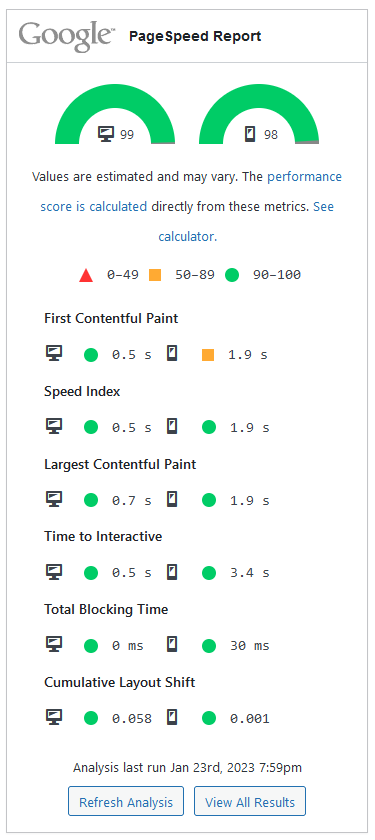
- The first section contains the legend and score gage which gives you a visual representation of the performance score on a 0-100 range where the higher the score is, the better the overall performance.
- The core metrics section is next which shows the 6 major metrics points. These are scored similarly to that of the score gauge in that green means good performance, yellow means less so, and red mean poor performance.

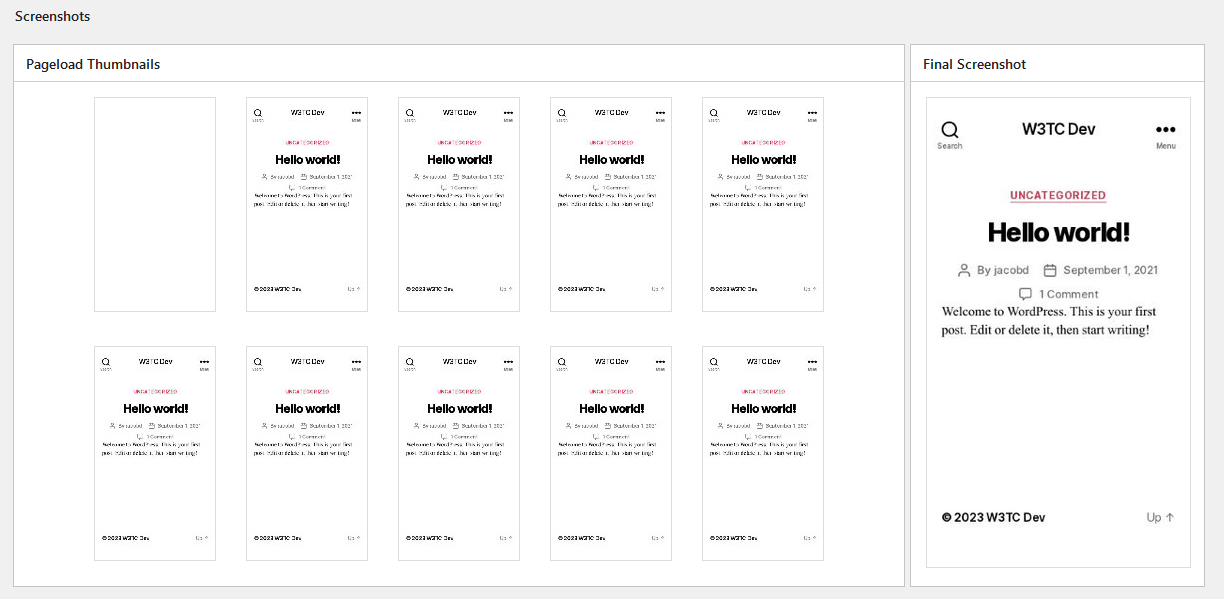
- The next section shows various screenshots generated during the analysis which gives you a visual indication of how the webpage elements loaded sequentially.

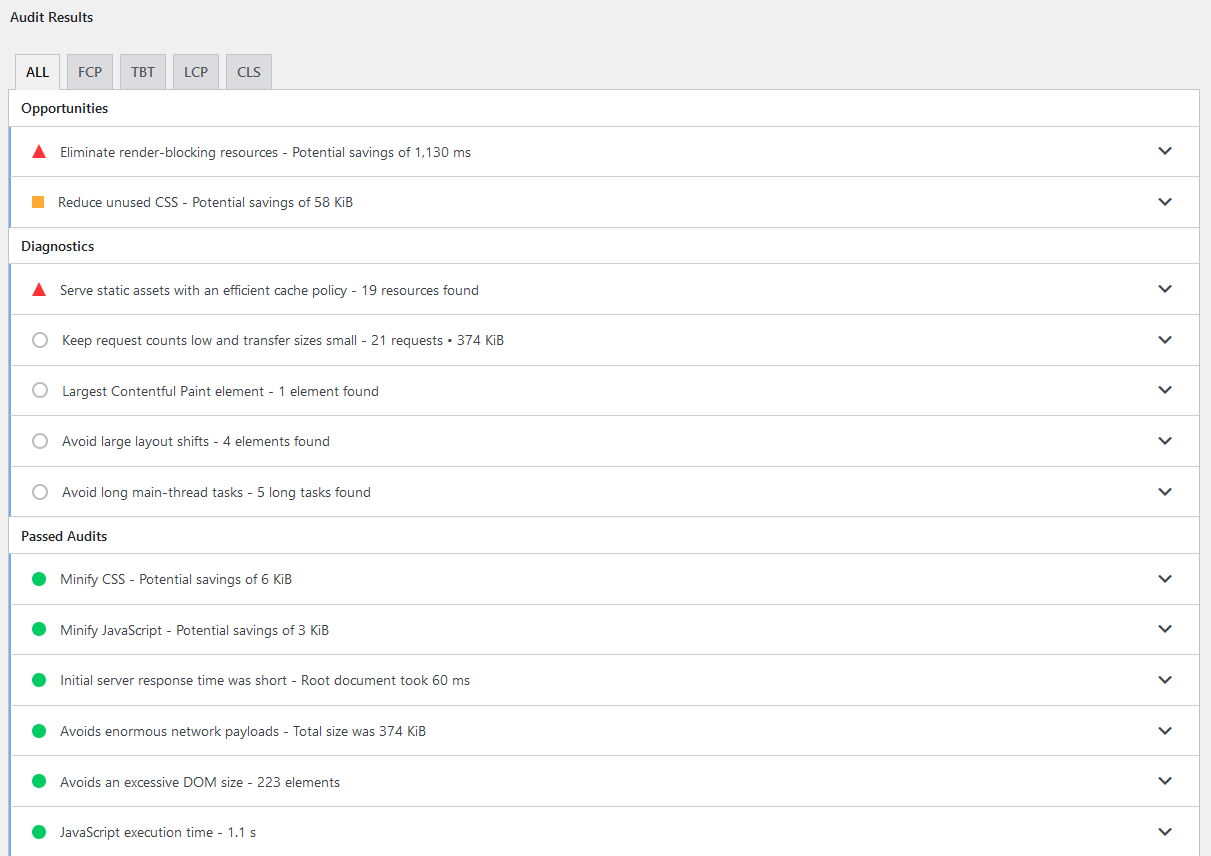
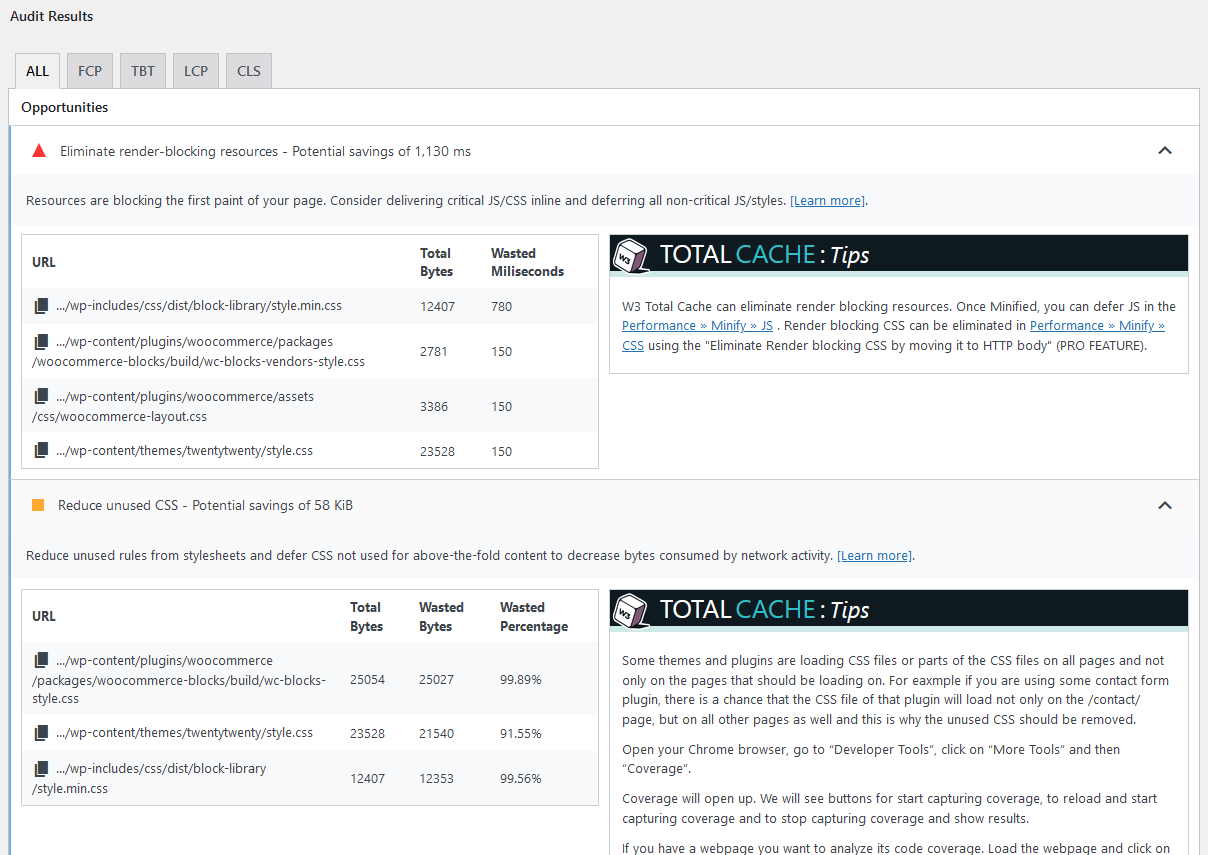
- The final section shows a detailed breakdown of each metric datapoint including a colored score icon to easily identify moderate or poor performance items. Clicking on any of these items will expand to reveal a detailed breakdown of the given metric as well as a brief description of the metric along with our recommendation as to how to address potential issues.


Widget
The W3 Total Cache Performance> Dashboard section of your WordPress dashboard will also feature a simple widget that will display the core metrics for your homepage. If no previous metrics have been collected or the previous results expire, this should perform an automatic analysis which can take up to 2 minutes to complete. The results will be cached for up to 2 hours but can be manually refreshed by clicking on the “Refresh Analysis” button.
W3 Total Cache
You haven't seen fast until you've tried PRO
Full Site CDN + Additional Caching Options
Advanced Caching Statistics, Purge Logs and More
Everything you need to scale your WordPress Website and improve your PageSpeed.
Ahmad says:
Hai, i got error about this.
Error : SyntaxError: Unexpected token ‘C’, “Could not “… is not valid JSON
How to solve this? Im use secondary gmail, how to unlink and maybe i can try my first gmail…?
Thank you
Ahmad
Marko says:
Hello,
You can try to re-authorize the google page speed tool
Do you have any security plugins buy any chance that may be blocking the requests?
Thanks!
Neal says:
Thanks for yet another useful feature for W3 Total Cache!
I have installed, activated, and authorized Google PageSpeed.
I have ticked the box for Enable Google PageSpeed dashboard widget but, hours later, the widget has not appeared on the WordPress dashboard.
Marko says:
Hey Neal,
Thank you for reaching out!
Once you enable the Enable Google PageSpeed dashboard widget in Performance>General settings (Scroll down to Google Page speed section), the widget is enabled in the W3TC Dashboard. So instead of going in the wp-admin Dashboard>Home, go to Performance>Dashboard section where the widget is located.
I hope this helps!
Neal says:
MARKO
Thanks for responding!
And it’s there and it’s working.
NEAL
PS: Now you might want to correct the line above under WIDGET that reads, “The WordPress admin dashboard will also feature a simple widget that will display the core metrics for your homepage.”
Marko says:
Hey Neal,
Thank you for the confirmation. You are right! We’ll make sure to clarify the location of the widget!
Thanks!
Neal says:
M
You are welcome!
Keep up the good work with W3 Total Cache.
N