What Is a Heatmap and How They Work
Website Marketing
If your refrigerator started to heat up instead of cool down, would you start to take it apart in hopes to fix it? Hopefully not! You could end up causing additional problems. In this case, you need a diagnosis from a mechanic to know what needs to be fixed or replaced.
The same ideas goes for websites. If you’re struggling with getting leads converting to sales, you don’t want to start to change things on your website without knowing what is broken or not working.This is where a heatmap comes in.A heatmap helps diagnose the problem with your website through giving a visual map of where visitors click, touch, move their mouse, and scroll. This allows you to see if certain elements on your BoldGrid website are either detracting, not working, or if there’s too much information on the page. Similar to when the mechanic tells you that the compressor died on your refrigerator, a heatmap will help you understand the specific issue with why your visitors aren’t converting to sales on your website.
How Does It Work?
The first step to put a heatmap on your website is to sign up with a heatmap tool, such as HotJar. They will give you a short script to place on your website. This script allows them to track mouse movement, clicks, touch, and even scroll, allowing you to see where your visitors spend the most time and what they completely ignore. From this data, you can make informed decisions on what needs to be updated or removed.
Let’s look at a few examples of heatmaps:

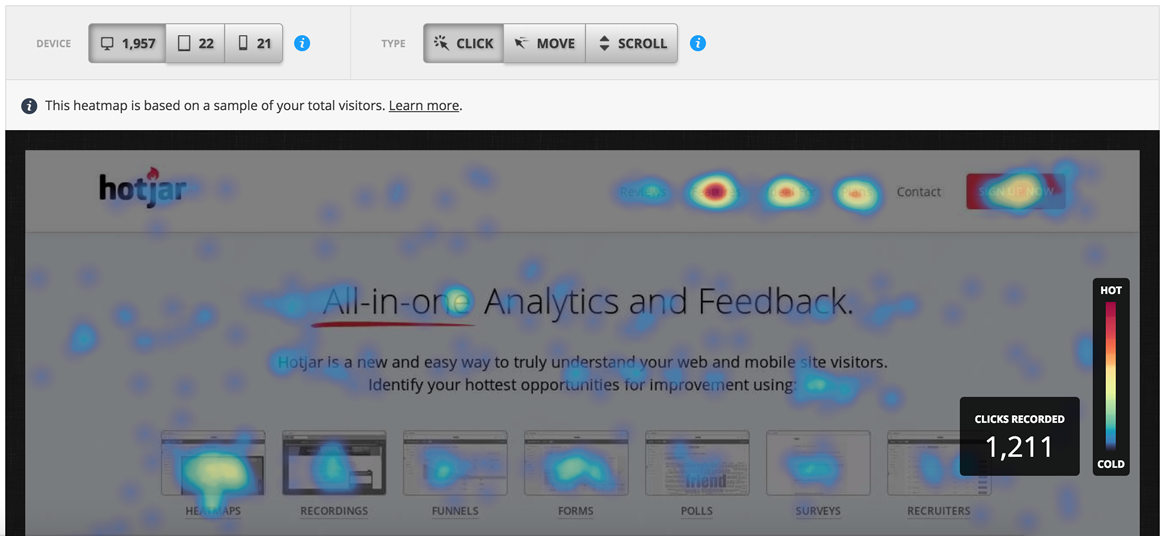
The heatmap above shows where visitors clicked. In this the case, we can see the menu, the red “Try for Free” button, and some of the main icons on the page were the key areas where the audience clicked. From this heatmap, we can see that the “Polls” and “Recruiters” icon areas aren’t as popular as “Heatmaps” and “Recruiters”. This is helpful for understanding where people clicked, but what about where visitors moved their mouse?

The above heatmap is showing where visitors moved their mouse. When visiting a website, most visitors will move their mouse around areas that stand out to them. This map shows some of the key areas of the website.

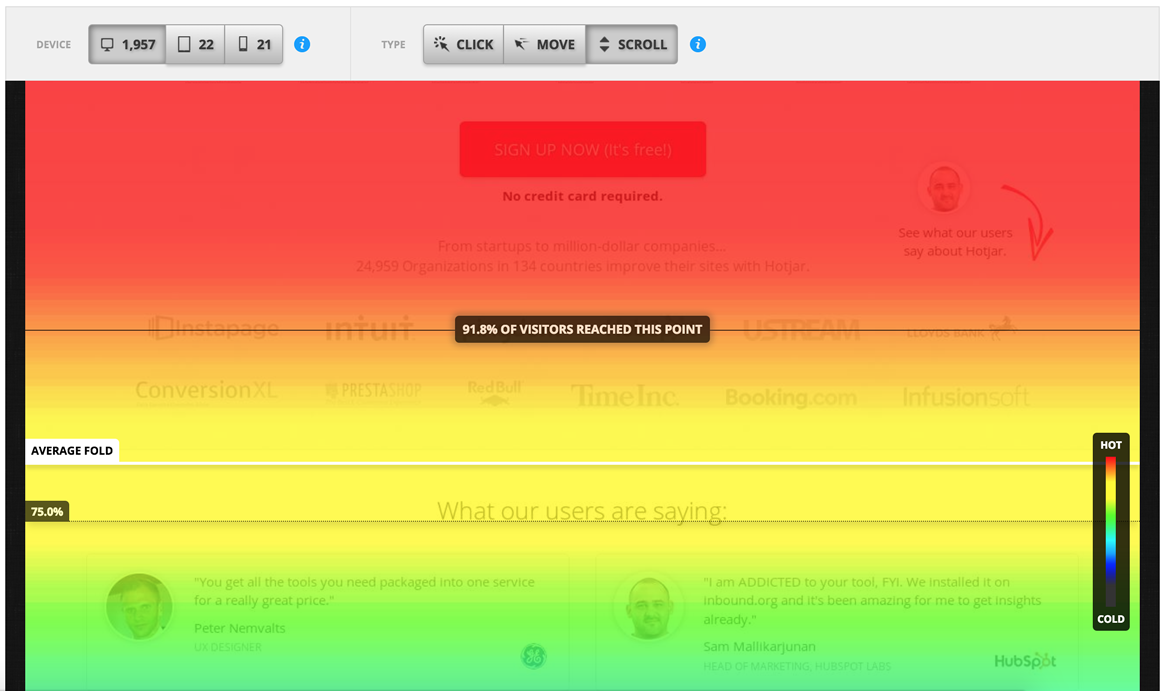
The above heatmap shows how far down your visitors made it on your website before leaving. Red means that 100% of visitors made it to that section of the page, where as green is closer to cold, where fewer visitors left the page before getting to a certain point.
Get a Heatmap on your BoldGrid Website
Start learning more details about your visitors through heatmaps so you can drive more traffic and sales to your products and services. Heatmaps are essential when you redesign your website, run A/B tests, and look for specific content marketing types to provide to your visitors. Easily install the HotJar tracking script on your BoldGrid website. There isn’t another tool like heatmaps that can bring ease and power to optimizing your website.